13 October 2026
What is an accretion-depletion study? A planner's guide to reach water balance
An accretion-depletion study balances flow between two gauges on a reach. Here's what it measures, why basin authorities run it, and where it runs short.
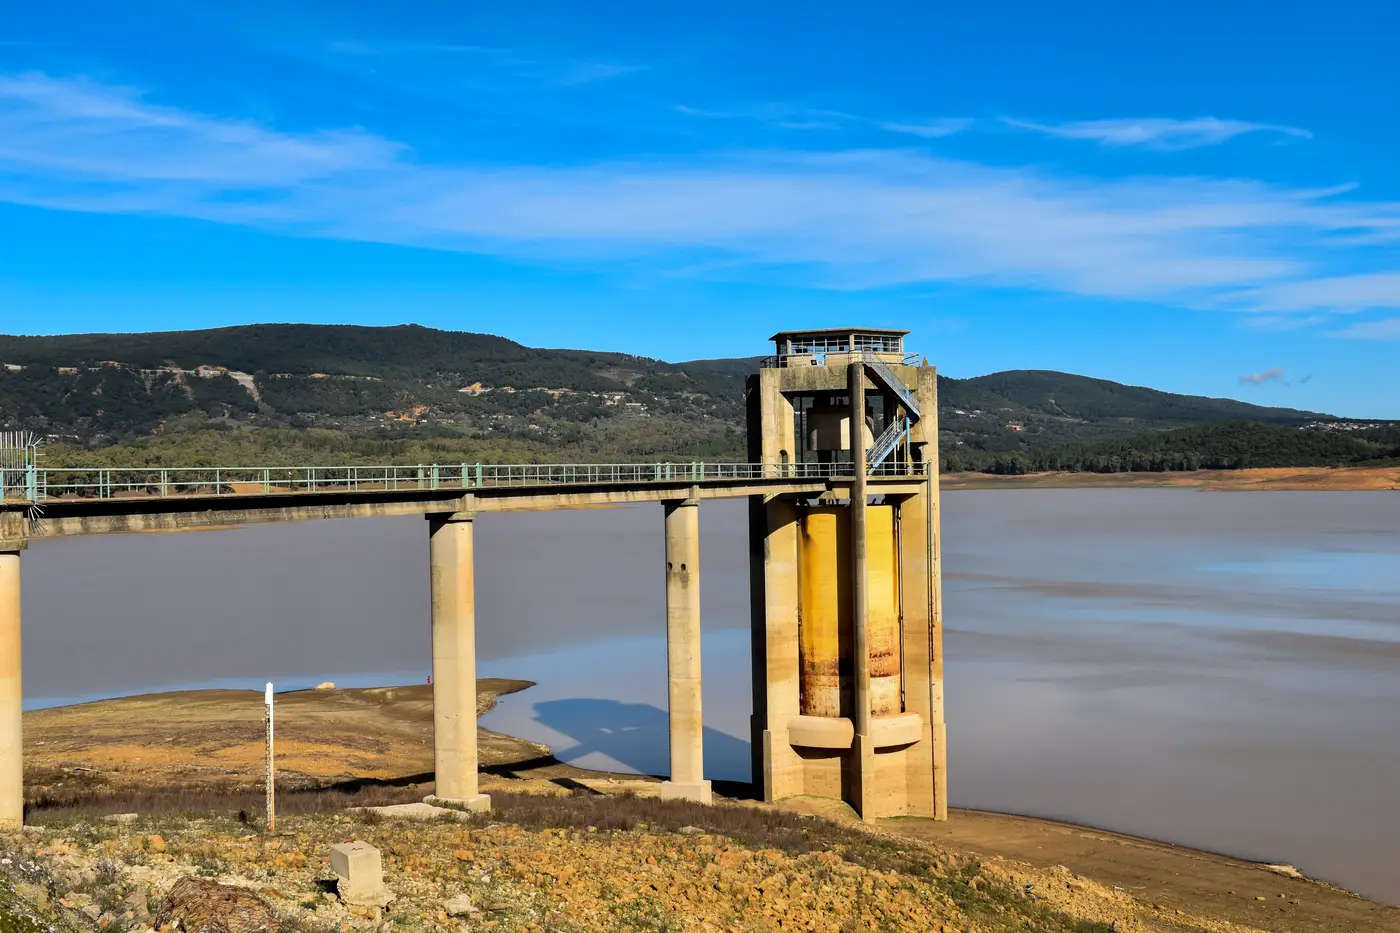
An accretion-depletion study is the basin accountant's version of balancing a checkbook for a river reach. You take the flow measured at the gauge at the top of the reach, the flow measured at the gauge at the bottom, add up every diversion, return flow, and tributary inflow you know about in between, and see what's left over. If the bottom gauge reads more water than the top gauge plus known inflows explain, the reach is accreting, gaining water from groundwater, bank storage, or ungauged tributaries. If it reads less, the reach is depleting, losing water to seepage, phreatophyte use, or unmetered diversions.
Basin authorities run these studies for the same reason they run anything: somebody needs an accounting that holds up when a water right holder challenges an allocation, or when a compact calls for delivery of a set volume past a state line. The method has been standard practice for decades because it works with the infrastructure most basins have: a string of gauges spaced miles apart, not a sensor on every bend.
The accounting works until the gauges run out
The math in an accretion-depletion study is only as good as the data between the two accounting points. Over a reach with no gauge in the middle, ten miles or fifty, the study has to treat that whole stretch as a black box. Any gain or loss inside it gets smeared evenly across the distance or lumped at the bottom node, because there's no way to tell from streamflow records alone where along the reach the water actually appeared or disappeared.
That's a real limitation when the question driving the study is operational and not just a ledger entry. Knowing a reach lost 4,000 acre-feet over the irrigation season tells you the reach lost water. It doesn't tell you whether that went into bank storage near an old oxbow, leaked out through a gravel run with no riparian cover, or left through a diversion nobody reported. Two reaches can post identical net losses in the water balance and have completely different hydrology driving each one.
Reading reach losses against what the basin looks like
This is where a weekly surface water extent layer earns its keep, as a second line of evidence sitting next to the gauge network. If you can see where standing water and channel width have expanded or contracted along the length of a losing reach, week over week, you can start narrowing down which segment is doing the losing instead of treating the whole stretch as one undifferentiated number. A reach that's been steadily contracting at its downstream end while holding steady upstream is telling you something different than one shrinking evenly along its full length, even if both post the same total depletion on paper.
For a basin authority doing streamflow accounting on long reaches with sparse gauging, that spatial picture doesn't close the ledger. The gauges still do that job. But it gives planners, and the staff fielding calls from water right holders, something to point at besides a number covering fifty miles of channel.
Surface Water Monitoring builds that picture from a weekly wide-swath pass stacked against a multi-decade archive, so you can watch extent change along a reach between the gauges you already rely on. If your next accretion-depletion study needs more than two endpoints to explain what's happening in between, that's worth a look.