GSD Wide / 10–30 mCadence WeeklyPlatform Wide-swath satelliteSpectral Multispectral
This week's water, set against the whole record.
Weekly surface water masks for the lakes and river reaches in your basin, stacked against the long-run archive, to sit beside your gauge records.
01The job today
What the gauges can't tell you
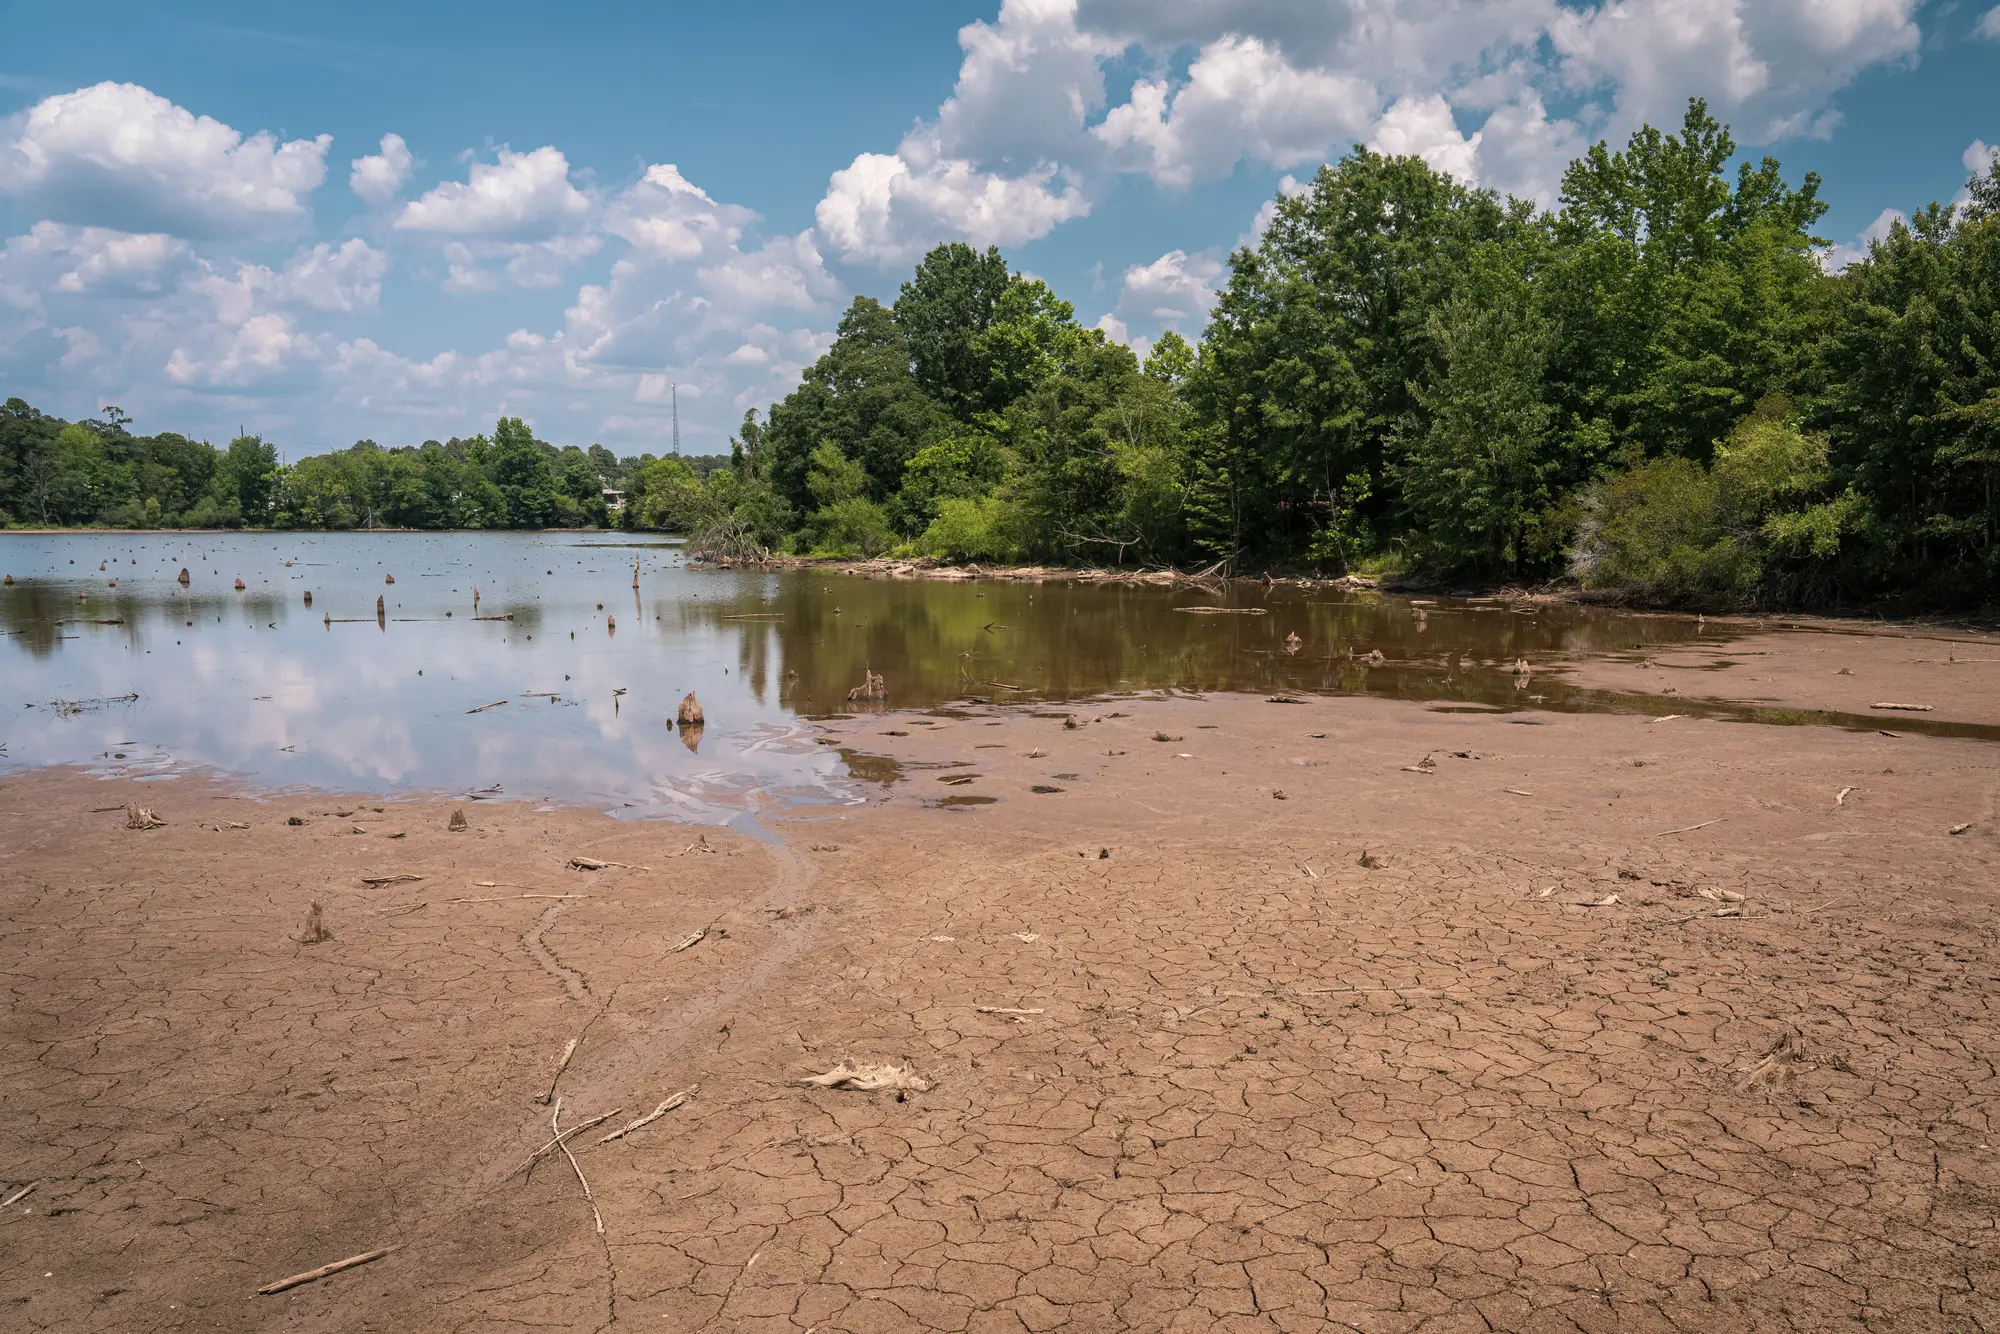
You plan water for a basin where many lakes, side reaches and wetlands have no gauge station. The stations you do have give you a proper hydrograph, stage and flow, and nobody argues with them. But the weekly conditions update asks about places with no station. Is the lake above the offtake pulling back from its banks? Has the side channel stopped carrying water? Which of the floodplain wetlands are going to be dry by the time the next allocation announcement goes out?
Today the answer comes from the water body inventory, which was drawn some time ago, from a field visit when someone can be spared, or from a one-off image pulled up for a report and never updated. In a dry run of weeks, you end up reporting what the gauges say and guessing the rest, and the guess goes into an allocation paper with your name on it.
What changes is a weekly extent map of the whole basin, with each water body's history behind it. You still trust the gauges for flow and stage. The map covers the stretches between them.1
02What you get
What arrives, and when
The extent layer comes weekly. The long-run record is delivered once at the start and extended as each week is added.
2.1Weekly extent layerGeoPackage or shapefile
2.2Time series per water bodyCSV and chart
Mapped surface area by date for each lake, wetland and reach, as far back as the archive covers it. Weeks without a clear pass stay as gaps and are never filled in. The CSV is built to sit beside your gauge record in a spreadsheet or hydrological database.4
Schematic series. The breaks are weeks with no clear pass, left empty. 2.3Change summaryPDF
A short list of the water bodies that have shrunk, grown, moved or gone dry against their own historical baseline, with the dates behind each call. Written to drop into the weekly conditions report or an allocation paper.
03The method
How it works
01Send the basin
A basin boundary as a shapefile or GeoPackage, or your water body inventory with its IDs. Tell us the years that matter to your planning.
02Archive check
Before any mapping, we look at how far back usable cloud-free imagery runs for your water bodies and tell you what record to expect.
03Map the water
Each weekly wide-swath pass is read into a water mask, and the extent of each water body is measured and set against its archive.5
04Hand-over
The back record, then each new week, as layers, time series and a change summary in formats that open in your GIS.
04Read this first
Limits
These are the ways an extent record from imagery can mislead you.
- 1
Extent, not flow
What gets mapped is the area covered by open water. There is no discharge, stage or volume in this, and it does not replace a gauge.
- 2
Cloud decides the week
Weekly is a target. A week with no cloud-free pass is skipped and shows as a gap in the series, and nothing is invented for it.
- 3
10–30 m is the floor
A pixel is 10 to 30 m across. Small ponds and streams narrower than a few pixels may not resolve cleanly, and narrow reaches under tree cover or in shadow can drop out.
- 4
Archive depth varies
Some sites have usable imagery going back decades, others far less. The archive check tells you which before you commit.
- 5
Edges blur
Reeds, mud flats and shallow margins make the water edge hard to call. Where a lake edge is mixed, the extent will move by a pixel or two from one pass to the next without the water changing.
05Readership
Who it's for
- Water resources planners and hydrologists at river basin authorities, who report on lakes and reaches that have no gauge.
- Teams that already hold gauge records and want a basin-wide extent layer and long-run baseline to read beside them.
- Allocation and drought-reporting staff who are asked which water bodies are shrinking fastest.
Who it's not for
- Teams that need flow rate, discharge, stage or volume. That takes gauges and rating curves.
- Real-time alerts or flood warning. A weekly pass is far too slow for that.
- Small farm dams and narrow streams that sit below a few pixels.
- A replacement for the gauge network.
06FAQ
Questions from basin authorities
Does this replace our stream gauges?
No. Gauges measure stage and flow directly. This maps where open water is, between and beyond the gauges, and sets it against the archive.
How far back does the archive go?
As far back as usable cloud-free imagery exists for your water bodies. That varies by site, so it is checked for your basin before any work is agreed.
What is the resolution limit?
10–30 m GSD. Water bodies and reaches smaller than a few pixels may not resolve cleanly.
Does cloud cover affect weekly delivery?
Yes. A week can be skipped if no cloud-free pass is available, and it shows as a gap.
Can it measure flow rate or depth?
No. Surface extent only, not volume or discharge.
How do we check it against our own records?
Every layer carries the date of the pass it came from, so you can compare it with a gauge reading, a field photo or a site visit on the same day. Tell us where your ground truth is when the basin is scoped and it can be set beside the series.
Will it match our water body inventory?
The masks are mapped fresh from imagery, so they will differ from an older inventory outline. Where you want per-body figures, your inventory IDs can be carried over so the two line up.
Who owns the layers you deliver, and who owns the imagery?
Use and ownership terms for the delivered layers are written into the contract before work starts. The public satellite archives the maps come from keep their own licences.
How is it priced, and how do we buy it?
Each basin is scoped and quoted on its own. You get a written scope you can take through your authority's procurement.